Toolbar properties
The web test editor has a
toolbar on its own to work on the web tests. There are different options
like adding a data source, set credentials, adding more requests
recording, adding plug-ins to the test, generating code, parameterize
the web servers, and creating the performance session for the test.
Add data source
We have seen the Form Post
parameters and Query String parameters and how to set the values of the
parameters using the property. Now each and every time we test the
application, we have to change the property every time. In case of load
testing too, it is difficult and time consuming process to test for more
users. In this case, we can directly link the parameters to the
available data in a different data source.
Visual Studio supports
different type of data sources such as CSV, SQL Server database, XML
File, Access, Excel, and any other database using OLE DB provider
connection.
To add a new data source:
1. Select the Add Data Source button from the Web Test editor toolbar which opens the New Test Data Source Wizard.
2. Name the data source and select the type of data source( Database, CSV, XML File).
3.
If you select the database, you can create a new connection using
either OLE DB or ODBC or SQL Server or Oracle data provider. For our
example here, select the CSV file as the data source and in the next
screen select the CSV file from the file location.
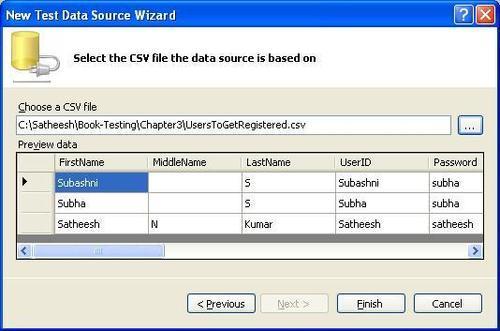
4. Once you select the file you can see the data in the preview data grid.
5. Once you say OK you can see the data source added to the test project.
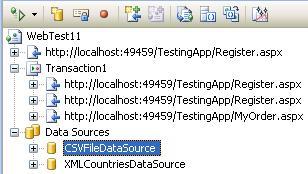
You can add any number of data sources based on the requirement and based on the sources of data we have for testing.
The screenshot below shows two data sources, CSVFileDataSource is for the new user data and the second one XMLCountriesDataSource is for the list of countries for the user.
Once the data source is ready, we can change the source of the Form Post or Form Query String properties. For this, select the Form Post Parameter under the request, then right-click and choose the Properties. In the Value property select the data source and select the field from the data source.
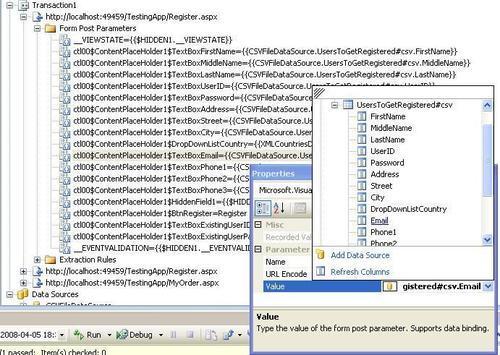
You can notice the value assigned to the form post parameters. It is pointing to the field in the selected data source like: {{CSVFileDataSource.UsersToGetRegistered#csv.FirstName}}
At run-time this field is replaced with the exact value extracted from the CSV file and the test runs successfully.
Set credentials
This is useful to set
the other user credentials to be used for the test instead of the
current user credentials. You can apply this user credential to test the
page, which uses basic authentication or integrated authentication. If
we have multiple user credentials to be tested against this web page and
if this user credentials are stored somewhere, we can use this as a
data source for credentials and bind the credentials field to these data
source fields.
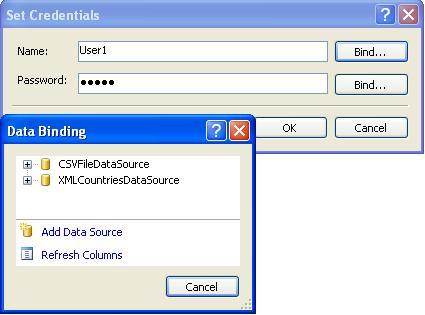
Credentials can be set using the option in the Web Test editor toolbar. Click the Set Credentials option and enter the User Name and Password values. If you have the data source already you can click on the Bind... option and choose the data source and the field for the multiple user credentials test for the test page.
Add recording
This option adds a new request
recording to the existing test. Sometimes we may forget to browse some
web pages during the record, if we don't remember all the web pages. So
after recording is done, we can still add requests to the recording
using this option. On clicking the option Add Recording in the Web Test
editor toolbar, you can see recording window opens for the new
recording. After completing the recording, this current recording will
get added to the existing Web test recording. This is one of the ways to
edit the recording. We can also delete a request from the existing
recording and add a new one.
Parameterize web server
All web tests are
recorded and conducted using one web server. If we have to test the same
test on another web server, then we were to re-record the whole testing
on the new server and test again. But now the VSTS provides the feature
of parameterizing the web servers. It means that the web server to
which all the web test requests should point is identified at run-time
using these parameters.
For example, this is required
in case of performing same kind of testing but with different hardware
configurations. The requests in the web test should point to different
hardware every time the configuration is changed. The test scenario is
the same in all of these cases but only the configuration changes based
on the parameter values set at run-time. This is very useful when the
application is tested for load testing, performance testing, and
integration testing where the configuration is the only change.
To parameterize the web server in web test:
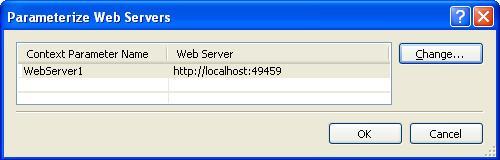
1. Select the Parameterize Web Servers option in the Web Test
editor toolbar, which opens the dialog that lists different web servers
used by the web test. The list contains the context parameter names and
the web server URL associated to the context parameter.
We can change the context parameter value to point to a different server by choosing the Change...
option after selecting the context parameter name form the list. This
opens the second dialog which helps us to change the name and the web
server URL.
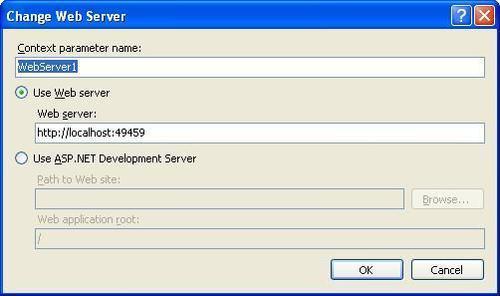
If you are planning to use the local ASP.NET development server, choose the second option which says Use ASP.NET Development Server and provide the local web site path and the application root.
After changing the value for the new context parameter, close the Parameterize Web Server dialog. Now we can see the context parameter added to the web test under the Context Parameters
folder. Also we can notice that the server address in the entire
request URLs in the web tests are replaced with this new parameter and
the value is held by the context parameter.
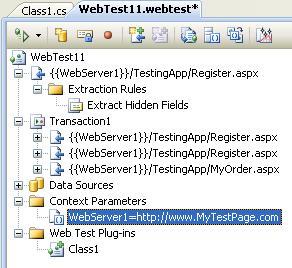
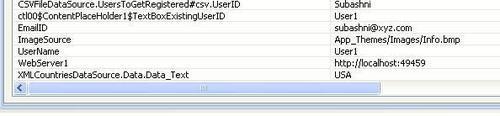
We can notice that the context parameters are used in the requests within the braces like {{WebServer1}}, which is replaced by the actual value at run-time.
Context parameters
There are different ways of creating context parameters:
1. By just right-clicking on the Context Parameters folder and selecting Add Context Parameter.
2. The plug-in can create the context parameter and assign the value in the event that runs before the web test.
For example, the plug-in assembly code below creates a new context parameter for the current windows UserName and adds the parameter to the web test. The code also assigns the UserName value to the existing Form Post Parameter field TextBoxExistingUserID.
public override void PreWebTest(object sender, PreWebTestEventArgs e)
{
e.WebTest.Context["UserName"] = System.Environment.UserName.ToString();
e.WebTest.Context["ctl00$ContentPlaceHolder1 $TextBoxExistingUserID"] = e.WebTest.Context["UserName"];
}
We can also have the context parameter added to the web test at design-time and assign the value at run-time using the plug-in.
Add web test plug-in
Plug-ins is the set of
external libraries or assemblies written for some custom functionality
which can run along the Web test. This plug-in runs once for every
iteration of the test. For example, a currency converter could be an
external service, which can be used as a plug-in to convert the currency
value in the test.
To add a plug-in, we need to
first create an assembly or a separate class library with a class
containing the custom code. The class should inherit from the Microsoft.VisualStudio.TestTools.WebTesting.WebTestPlugin and should implement the methods PreWebTest() and PostWebTest(). Atleast one of these methods should be implemented:
To get this namespace, we have to add the reference Microsoft.VisualStudio.QualityTools.WebTestFramework
to the assembly. Now after completing the coding, add this assemble
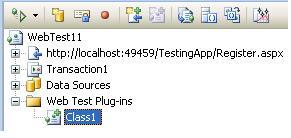
project reference to the Web test project. Then select the web test and
choose the option Add Web Test Plug-in from the toolbar which will list the classes within the assembly. Select the class, it will get added to the test project.
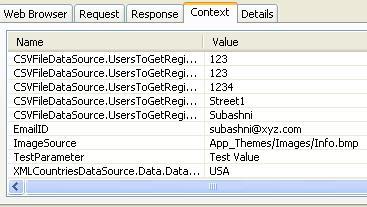
For example, if the class contains the following code in it, we can see
the context variable with the value added to each request in the web
test. The e.WebTest.Context contains the current context of the web test. The e is the current object which fires the event. The parameters and properties for the current context can be accessed using the e.WebTest.Context object.
using System;
toolbar properties, web test editorweb test plugin, addingusing System.Collections.Generic;
using System.Linq;
using System.Text;
using Microsoft.VisualStudio.TestTools.WebTesting;
namespace WebTestPluginSample
{
public class Class1 : WebTestPlugin
{
public override void PostWebTest(object sender, PostWebTestEventArgs e)
{
}
public override void PreWebTest(object sender, PreWebTestEventArgs e)
{
e.WebTest.Context["TestParameter"] = "Test Value";
}
}
Add request plug-in
This is very similar to the
web test plug-in but the only difference is that the plug-in code runs
for every request in the web test. This is the custom code written for
complex functionality which should run before or after every request in
the web test.
The code assembly should reference the library Microsoft.VisualStudio.QualityTools.WebTestFramework and the class should inherit from Microsoft.VisualStudio.TestTools.WebTesting.WebTestPlugin and implement the methods PreRequest() or PostRequest() based on whether the code should execute before the request or after the request.
Performance session for the test
From running the test, we will
come to know only the success or failure result of the test and
different parameter values handled in the test. But to get the actual
performance of the functions or method calls and the time taken for all
the methods within the test, VSTS provides the performance session. This
performance session is the profiling tool collecting run-time
performance data for the application.
Performance session reports
various information like the method calls, memory allocations, and the
time spent in running the methods. To run the performance session:
1. Select the web test and choose the option Create Performance Session for this Test which opens the Performance wizard. The wizard provides two options for the session type.
Sampling:
This technique collects information like the CPU time taken for the
methods. Also the information collected is between the specific time
intervals.
Instrumentation:
This technique is used in case of collecting more information from the
test and the external programs called within the test. This method is
used in case of smaller tests as the information collected is more than
sampling.
2. After selecting the required option, choose the current test application from the list.
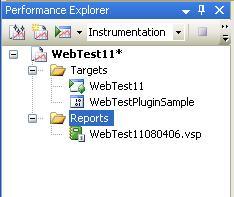
The Performance Explorer opens with the new performance session for the selected test. The explorer contains two folders one says Targets and other says Reports.
The targets are the application under profiling. The report contains
the list of reports collected on every run of the test from the
performance explorer.
Now launch the test application from the Performance Explorer
using the options in the explorer. It starts the application to run and
at the same time the profiler starts collecting the execution data from
the running application. At the end of completing the application run,
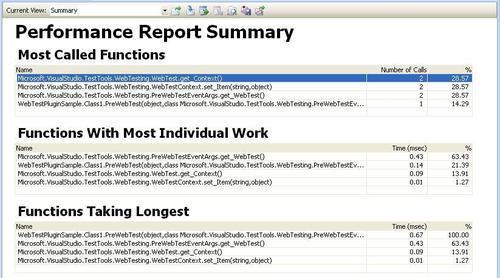
the profiler produces a report, with all the information collected by
grouping them based on the functionality as the one shown below. This is
the default summary view of the report.
We can change the summary view to a
different type of view by selecting the different options given in the
toolbar. We can also export the result for further analysis.
The Performance Explorer
also provides options to set or change different properties of the
profiler. We can change the type of profiling and the data to be
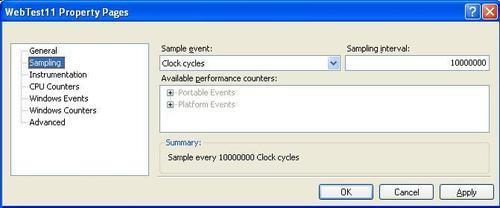
collected during data collection. For example, setting the clock cycles,
Page faults, system calls, and performance counters in case of Sampling method of profiling. We can also set properties for CPU Counters, Windows Events, Windows Counters.